 The averages in the below chart include the night and day time temperatures averaged together. As a result the day time average temperatures are actually quite a bit higher then the ones listed below.
You can be sitting downtown State Street in the middle of January and its 80 degrees out and the sun is shining warm on your face – while most of the rest of the country is buried in snow and or experiencing bitter chill.
The typical type of weather in Santa Barbara can be described as very pleasant and moderate year round.
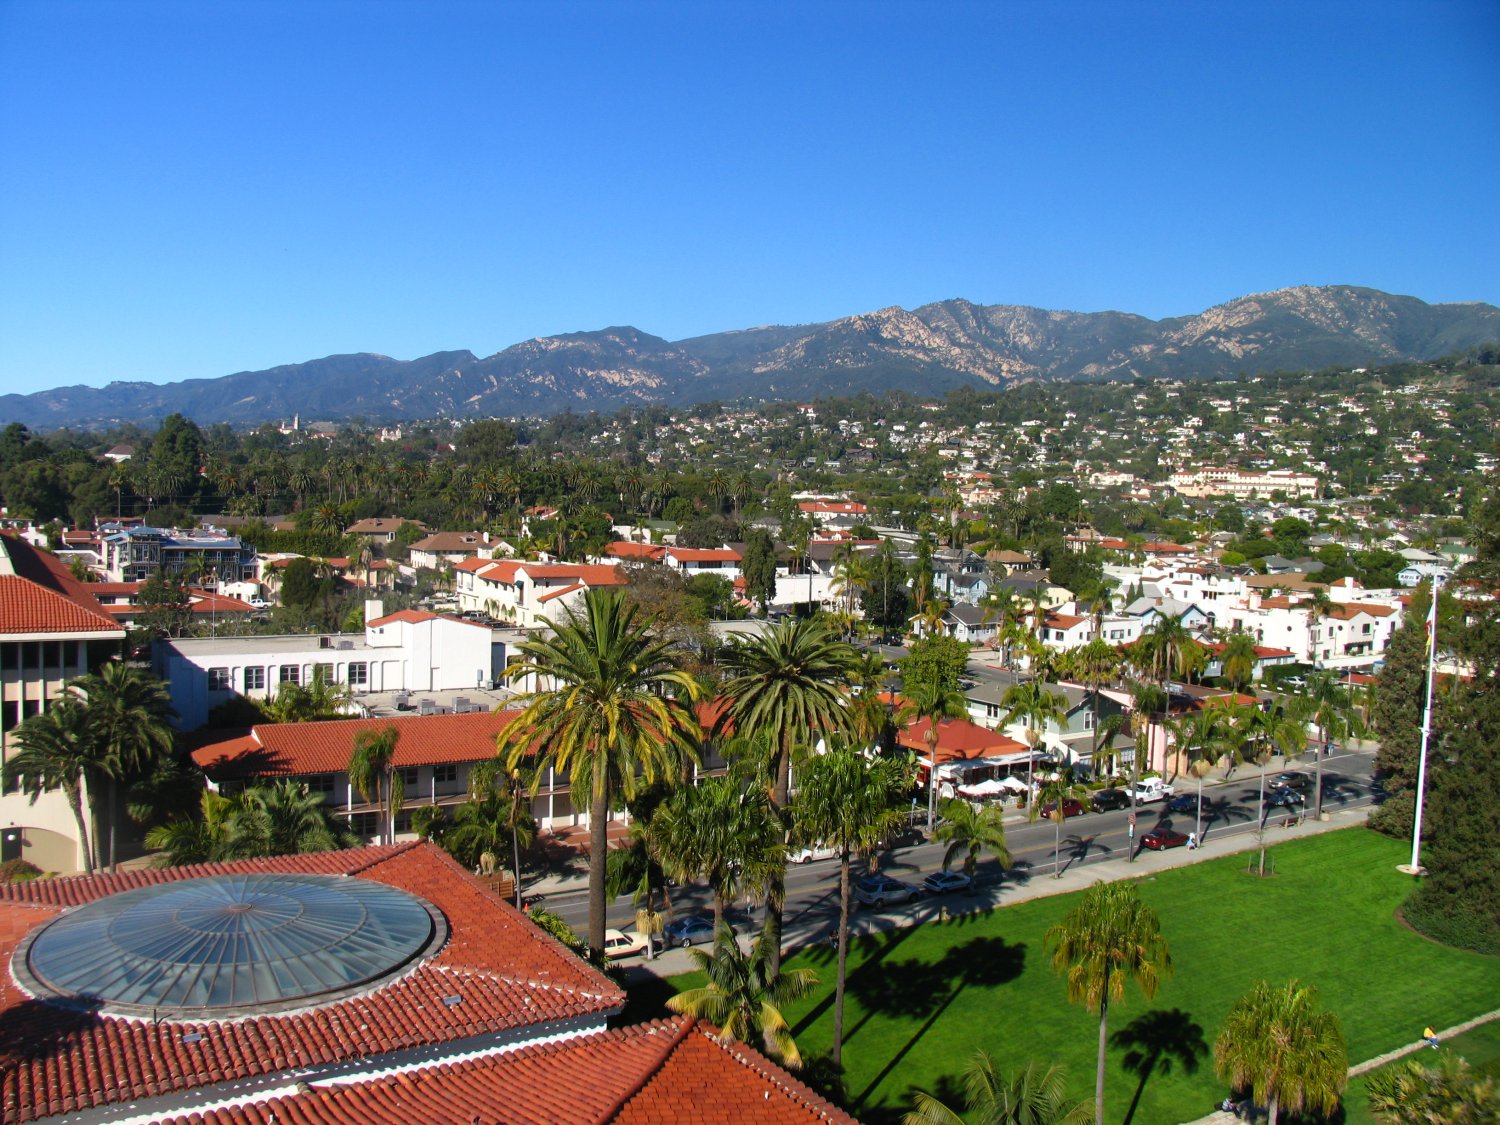
Photo: taken from top tower of the Santa Barbara courthouse on a spectacularly clear warm winter’s day
Sure there will be brief days of heavy rain in the winter – and extremely rarely, a Simoon (derived from short hot sand related storms in Africa) which is a very rare condition which produces high temperatures for a few hours or so – but most of the time the weather is quite pleasant.
Santa Barbara had a Simoon like condition last in 1990 during the Painted Cave Fire – but an even worse one occurred in 1859. Reference here: http://answers.google.com/answers/threadview?id=564672
Call: Phone (805) 892-2250, ext. 5420 for current weather conditions.
| Month | Avg High (°F) | Inches |
| January | 64 | 4.3 |
| February | 65 | 3.8 |
| March | 66 | 2.3 |
| April | 69 | 1.5 |
| May | 70 | 0.5 |
| June | 72 | 0.1 |
| July | 75 | 0.05 |
| August | 77 | 0.1 |
| September | 75 | 0.3 |
| October | 73 | 0.4 |
| November | 69 | 2.0 |
| December | 65 | 2.5 |
Leave a Reply